This serves as a recap for myself and is not to be viewed as any kind of trade suggestion. All views expressed are my own.
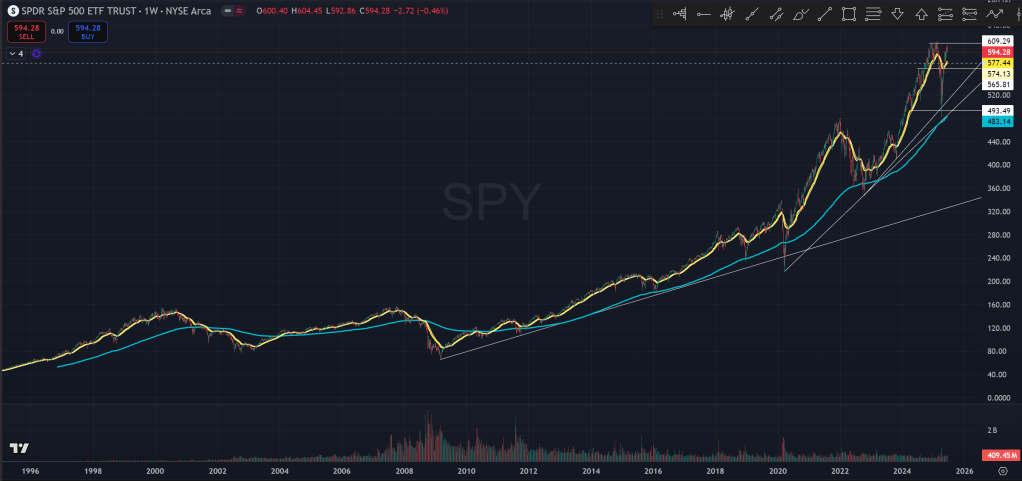
I want to start today with this chart here showing the SPY weekly over the past 3 decades.
It’s easy to see that we have been in a bull market on this grand scale since the GFC low in 2009. Price made a few episodes of drawdowns with varying degrees of speed, length and magnitude, but each time price was able to recover from the sell-offs and continue upward, sustaining the broad uptrend.
Given how financialized everything is nowadays, one can say that the central bank is very unlikely to allow a break of this grand bull trend that lots of wealth for lots of people are tied to.
Also notably, price has entered into a steeper bull trend ever since the 2020 pandemic crash and the subsequent trillions of liquidity being injected in the market.
A rate hike cycle in 2022 was able to create a brief bull market correction in the grand scheme of things before everything started to go back higher again on the hopes of rate cuts and all the good things AI can bring us.

Price got above the 2022 high at the start of 2024. But on the way up since then, there had been more and more episodes of growth scares or (geo)political scares or inflation scares or some other scares, that created brief yet strong and sudden periods of sell-offs.
Such as in Apr of 2024, when price sold off quickly due to hot inflation, taking away some baked in expectation that the Fed will be cutting several times starting in the middle of the year.
Or in late July and early August of that year, when Japan central bank unexpectedly became a bit hawkish causing some yen carry trade unwinding, coupled with growth scares in the labor market that triggered fears of potential recession.
Note how in each of the cases, the EMA 21 of the weekly chart held nicely, and buying the dip was always a good idea.
Then in December of 2024, after an initial cheer in the market for DJT in the office, market hit a snag and started to stall for about 2 months. The reason? There were a lot of talks about tariffs and trade wars and there were concerns regarding inflation if high tariffs were to be installed and stayed in place.
Market notably fell below the key EMA which held the market for so long in the first week of March 2025, and was unable to quickly get above the level to invalidate the sell-off, like market did in August of 2025.

This meant that the immediate bull trend since late 2023 after that mid-summer correction has been lost and price could be testing down to the core bull trend line since the low of 2020 and 2022.
Sure enough, with the liberation day and its aftermath, price quickly sold off 10% in a span of 3 days, and sold off some more on the next Monday during the Sunday overnight session, to hit a low that neatly tested the key trend lines as well as the 200 EMA on the weekly and held the test. Price rallied since and was notably made a never-before-seen 10-12% rally (depending on which index you check) on that fateful Wednesday Apr 9th 2025.
We have rallied back all the way (almost) to the 2025 Jan/Feb peak with just about 2.5% shy of that ATH level. The speed and magnitude of the sell-off and the recovery was historic, just shy of the 2020 pandemic sell-off and recovery.
But that happened at a much lower price level with a much more resilient economy and perhaps a much more stable global order and backdrop. And the Fed at the time was swift in cutting rates and doing QE, while this time the sell-off and recovery were both almost entirely driven by the tariffs or threats of such. Not to mention the US treasury debt problem and de-dollarization and all that fun stuff.
Nonetheless, price has since reclaimed the EMA 21 on the weekly chart, triggered by the US-China trade deal which was essentially a pause on additional tariffs for 90 days. Since then, price has somewhat stalled again, with now additional geopolitical scares in the middle east.
Which brings us back to the recent week using the futures chart.
One can see that the week ended up being a down week, after initially looking promising on Monday with a bullish trend bar closing on its high. Price eventually was unable to bounce immediately on this test of the EMA 21 and instead had to test below and potentially trap late bears before being able to spring higher on trapped forced exits.
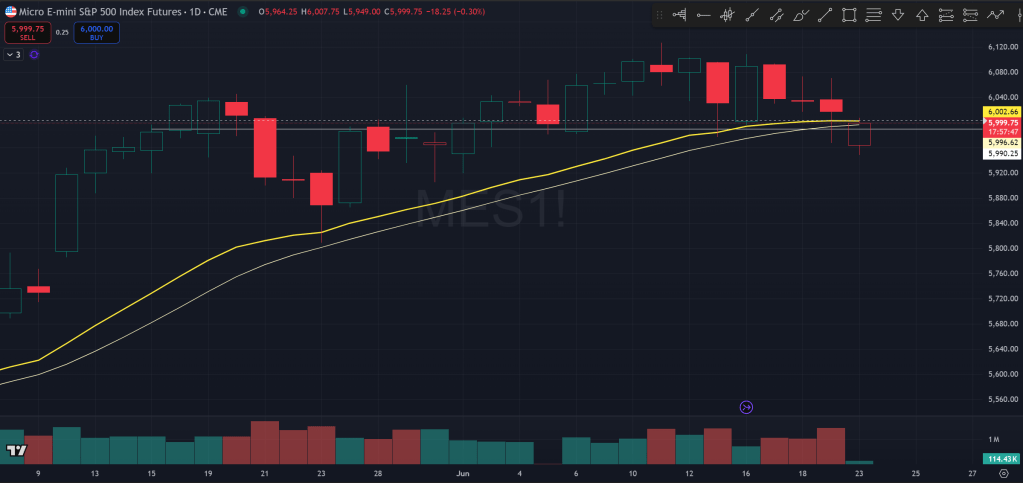
Or alternatively, this could be the start of another leg lower, given that price again looks extended without significant pullbacks since the Apr 7 low. Since getting above the daily 21 EMA in late April, the only other test of the EMA was on May 23rd. Price has also now formed a wedge, signaling increasingly weaker buying demand versus selling interest.
Over the weekend, the US struck Iran’s nuclear facility. So far, it’s unclear how this will evolve over the coming days in terms of if and how Iran might retaliate and whether if the situation in the region might defuse.
But in any case, the geopolitical backdrop is certainly much more volatile compared to 5 years ago, with now several warzones in the world having killed many thousands of people.
A few hours ago, futures opened for overnight trading and immediately gapped down. But that gap down was quickly reversed with no follow up selling whatsoever.
However, like I always say, what really matters is what happens during the US (and EU session to a lesser degree). It will be crucial to see what price does tomorrow during the day and how it closes at the end, to see if participants are taking the catalyst to derisk or using the sell-off below EMA as an opportunity to add to risk, positioned for potentially new ATH.
Last week (Friday) was also the quad witching day with monthly and quarterly options and futures expiring. This could mean that price can get out of the trading range over the past month and starts to make some kind of trend either higher or lower.
If I was forced to make a prediction here, I’d be saying that price trends lower from here, not only because the rally since Apr low has been very strong and impressive and likely needs a breather before attacking ATH, but also because I view the grand picture and am suspicious now about if price could get back to the head-spinning bull trend with increasingly steeper ascension rate on the weekly or monthly chart.
The world now looks to be increasingly chaotic with the growing stress between rising and existing global powers. I’d say the good ol’ days might be starting to fade away (or maybe already has) and at the very least we could be in for some years of bumpy ride in the form of large trading range and wild swings.
The Ephemeral Tourist
June 22. 2025 @ 10:27pm CST
