This serves as a recap for myself and is not to be viewed as any kind of trade suggestion. All views expressed are my own.
Over the past week, equities suffered further drawdown with the most notable intraday reversal seen on Thursday 11/20.
This happened right after NVDA reporting another stellar earnings while we got our first piece of more important econ data since the government shutdown reopening.
During overnight after the NVDA earnings, equities all rallied and held the gains during the cash open on 11/20. Everything was looking good. But at around 9:45am CST, some relentless selling hit the tape and the SPX dropped nearly 3% from the peak in a span of just around 2 hours.
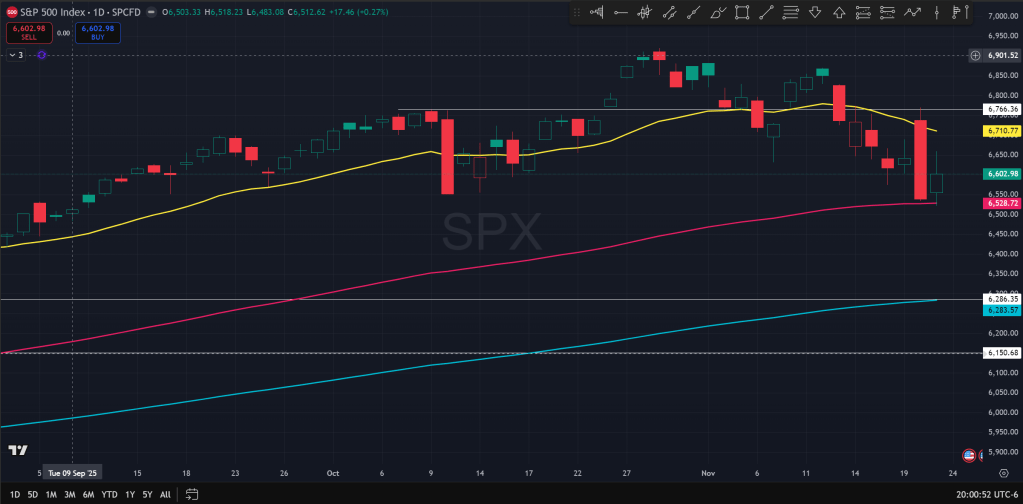
If one looks at the above day chart for the SPX, it is somewhat easy to see in hindsight that price peaked that morning at about where it hit the 21 EMA on the daily chart. This came after a lower high from 10/29 to 11/12, and a lower low from 11/7 to 11/18.
Now we all want to find some reason for big moves like these. But in reality it’s most likely a multitude of factors. It might have started as some more technical focused larger account decided to get out of dodge at the 21 EMA, seeing that the technical picture has turned considerably sour over the past few weeks.
Or maybe the reason for selling was just locking in profits after the incredible run since Apr. Or maybe there was growing angst regarding AI and the circular investment among the big players and the fact that they are raising debt to invest in something that might not have a clear profit prospect.
Regardless the initial reasoning, this was likely compounded with selling from late buyers that might’ve added to longs on that morning, seeing that NVDA had delivered good earnings. Dip buyers especially the retail kind might have become exit liquidity for the institutions, that eventually sold later to exacerbate the selling.
After the bloodbath that was 11/20, we see that price was at about the same price as the low made on 10/10. Price also touched the 100EMA on the daily chart. If we zoom out to the weekly chart, we can see that price also touched the 21EMA on the weekly chart.

This could be the sign that we would be getting some kind of relief bounce. Sure enough, price was able to hold the ground on Friday despite some wider ranges and bounced in the morning.
Could we get some further relief this coming week?
For SPX, I would be watching the 6660 level which was the Friday intraday high where the bounce stopped, and also the open gap low from the Wednesday NVDA earnings. If price is able to reliably reclaim the level then confidence grows that the gap could be filled with a bounce to 6700-6740. If the 11/20 sell-off can be fully retraced, conviction grows that the correction would be done.
If, however, price encounters significant resistance ahead of the high of 11/20, it could mean that we are entering a more sustained period of correction instead of a pull-back, and in that case the level of 6150-6200 which was the high at the beginning of the year will be a potential target.
The Ephemeral Tourist
November 23rd. 2025 @ 8:57pm CST
