This serves as a recap for myself and is not to be viewed as any kind of trade suggestion. All views expressed are my own.
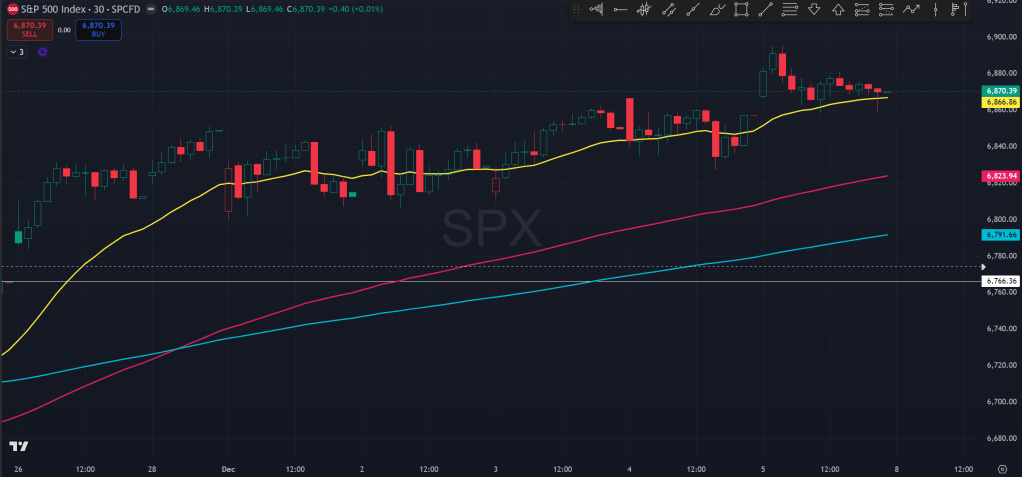
Over the past week, SP500 was fairly choppy but ended slightly higher. On Friday, price had a notable move higher after the delayed September PCE, showing a mostly in line inflation number. However, the move higher was soon reversed as cash trading went under way and closed near where the day opened at.
The rally back higher since the 11/20 sell-off was apparently driven by the expectation that the Fed will still cut 25bps during its December meeting. The CME Fedwatch currently shows a 86% probability that the Fed will cut 25bps next week. This contrasts sharply with that back on 11/19 and 11/20, when the probability for a cut was only about 30-40%. We will see if Powell will deliver the rate cut as expected.

During last week’s recap, I said that I think the pullback is now complete, given that the 11/20 sell-off has completely been reversed and reclaimed. However, this week’s rather weakish kind of action in the first week of December has somehow given me a bit of pause.
Zooming out to the monthly chart, one can see how price made a downside rejection wick in the month of November, closing at the high after a rather significant sell-off. December so far is off to a reasonable start, holding the high and could be poised to move higher and sustain the trend.
However, if price is unable to clear and close this month above the ATH which was the October high of 6920 for the SPX, the conversation gets flipped to whether if we just made a top. It is not unreasonable for price to first go down for a few months in the new year to test back the early 2025 high before the April sell-off.
In fact, if price really was able to get down to that level, it would be a very good spot to be looking to get risk-on again. It would be about 10% off from the previous ATH. It would have the confirmation that prior resistance has turned to support. It would also be around the 21EMA of the monthly chart. So it is perhaps imaginable if larger participants with longer time horizons might be holding off of adding positions but instead will be looking to load again at a lower price.

Now down to the weekly chart, one can see the test of the 21EMA is almost perfect. It touched and spent minimal time and went higher, as dip buyers quickly came in. However, the speed of the recovery almost feels like it could be part of a more complex topping process, as there is not a lot of panic and fear that would mean the sell-off has gone far enough.

And down to the daily chart, we can view the price action over the past 2 months as basically sideways and could indeed be topping or just an episode of consolidation for a leg higher. Notably, price is no longer riding the 21EMA on the daily chart, but instead have been spending about equal time on both sides of the EMA.

Another piece of interesting perspective is how bullish retail has turned just this week following the Thanksgiving rally. Usually, I’d say when retail is bullish it could be foreshadowing some bumpy ride in the future. It’s worth keeping an eye on, even though this bullishness is not yet extreme.
So it all kind of hinges on next week’s Fed meeting. Not only will we get the answer of whether or not the Fed will cut another 25bps as Powell is on his last stretch of his term, we will also be getting the Summary of Economic Projections and the dot plots, showing how participants think about today’s economy and 2026 rate projections, especially in the face of delayed and missing data points due to the monthslong government shutdown.
Price has been choppy over the past week and waiting for the key catalyst to perhaps be making a move. Overall, I’ve grown considerably more cautious compared to last week, just because the expectation on the Fed appears to be reasonably high, and it could be at risk of disappointment. We will know more after the FOMC and from market participants’ reaction.
The Ephemeral Tourist
December 7th. 2025 @ 9:29pm CST
